NOW AVAILABLE
The CT Management Group 2020 Council Financial Ratios Benchmarking Data Pack is now available for Victorian Councils.
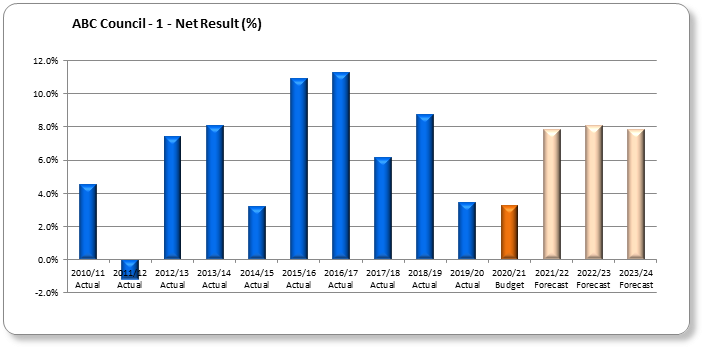
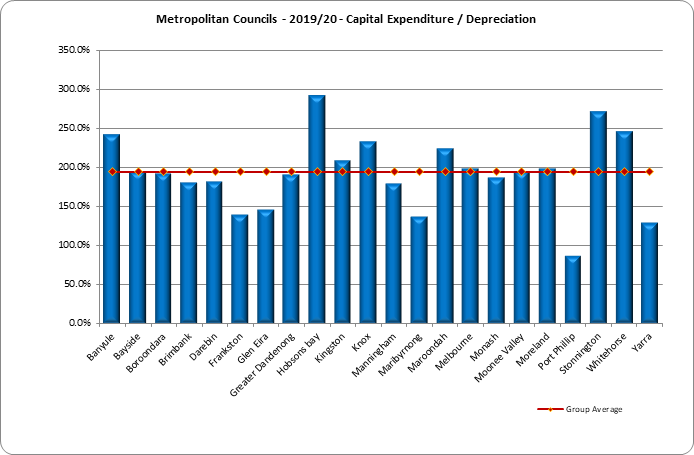
The data pack provides your council’s individual 10 year historical information and four-year forecast in a summary data table including graphs for over 80 ratios; along with summary data tables and comparative graphs for your council’s group (showing the group average) for the 2020 financial year.
You can compare your council to other council groups, councils within your region or other regions; or every council in the state.
The data and graphs report on VAGO, Revenue, Expense, Debt, Capital, Financial Position and Financial Performance and LGPRF indicators.
CT Management Group’s 10 years of data captured from audited Annual Reports provides accurate and consistent information and statistics and can be used to:
- Alert council to performance issues
- Ensure compliance with VAGO indicators
- Support predictive modelling
- Support CEO performance reviews to demonstrate council’s financial performance succinctly
- Provide details for council’s website and support communications
- Compare data from like councils
- Compare data to other council categories
- Benchmark against all councils on all performance measures
- Provide comparative graphs to like sized councils for the current year
- Assist when councils are looking at service reviews and considering the impact of rate-capping as determined by the Essential Services Commission.
The 2020 Financial Ratios Benchmarking Data Pack is now available for $2000 ex GST.
For your 2020 Financial Ratios Benchmarking Data Pack or to view the content of the data pack online, please do not hesitate to contact Sonia Giofches on 1300 500 932 or via the contact form below.